Image Details
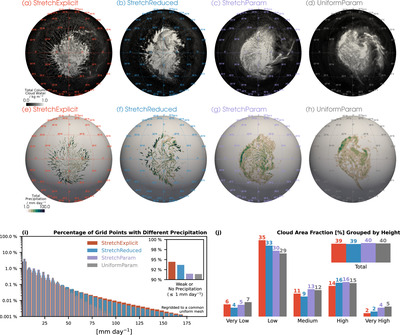
Caption: Figure 2.
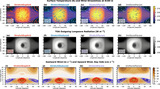
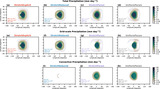
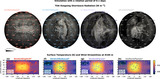
Clouds and precipitation in the simulations with stretched (StretchExplicit, StretchReduced, StretchParam) and quasi-uniform (UniformParam) mesh. (a)–(d) Maps of instantaneous vertically integrated cloud water (liquid plus ice) at the end of the simulations (kilograms per square meter). (e)–(h) Maps of instantaneous precipitation rate (millimeters per day). The substellar point is at the center of the maps (0° N, 0° E). (i) Histogram of instantaneous precipitation rate interpolated to a common quasi-uniform mesh (same mesh as in the UniformParam simulation). The histogram shows the percentage of grid cells with precipitation above 1 mm day−1, binned with a step of 5 mm day−1. Note the logarithmic scale of the vertical axis. The inset shows the percentage of grid cells with precipitation below 1 mm day−1 (weak or non-precipitating points). (j) Bar chart of cloud area fraction (%) grouped by different heights. The experimental setup is detailed in Figure 1 and Section 2.
Other Images in This Article
Copyright and Terms & Conditions
© 2024. The Author(s). Published by the American Astronomical Society.