Image Details
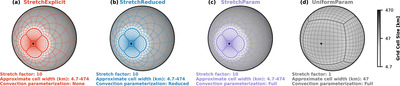
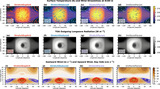
Caption: Figure 1.
Summary of the simulation setup. Gray shading shows the cell width (km) calculated as a square root of the cell area. All simulations use the C192 mesh. Thick lines are the boundaries of cubed-sphere faces, and thin lines are the boundaries of every 16 × 16 grid cells. The black dot shows the location of the substellar point. For more details on the stretching procedure, see Appendix A. Here and throughout the paper, the experiments are color-coded: StretchExplicit is shown in red, StretchReduced in blue, StretchParam in purple, and UniformParam in gray.
Other Images in This Article
Copyright and Terms & Conditions
© 2024. The Author(s). Published by the American Astronomical Society.
Copyright ©
2025 Astronomy Image Explorer. All Rights Reserved.