Image Details
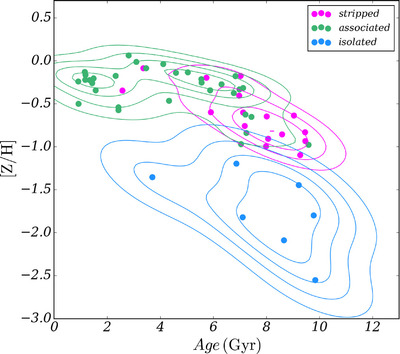
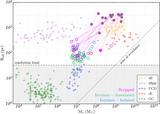
Caption: Figure 6.
The metallicity and age distribution of 38 UCD candidates. The magenta, green, and blue colors represent the stripped, intrinsically associated, and intrinsically isolated samples. The contours for each color are the kernel density estimation of each sample.
Other Images in This Article
Copyright and Terms & Conditions
© 2024. The Author(s). Published by the American Astronomical Society.
Copyright ©
2025 Astronomy Image Explorer. All Rights Reserved.