Image Details
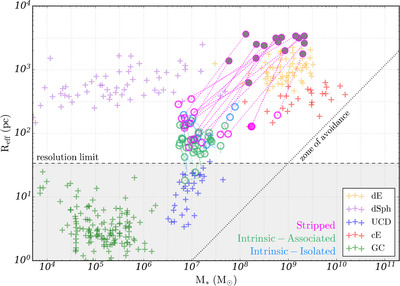
Caption: Figure 4.
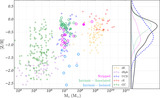
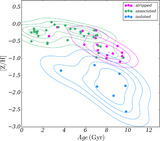
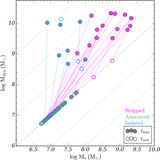
The size–mass relation of the galaxies at z = 0.17. The crosses with different colors show the observed catalog data of Janz et al. (2016), and the circles show the simulation samples. The magenta circles correspond to the stripped objects, the green circles show the intrinsically associated samples, and the blue circles show the intrinsically isolated sample. The gray-filled circles are the points when the stripped samples were at their maximal points in terms of size (R eff), and they are connected with a dotted line to their z = 0.17 counterparts (open circles). The intrinsically compact objects (green and blue circles) also have a short dotted line that shows the change in their size and mass since their birth. Their birth properties are not shown here for the sake of clarity. The magenta- and green-filled circles are the objects shown in Figures 2 and 3, respectively. The maximum spatial resolution of the simulation (black dashed line) and the zone of avoidance (black dotted line) are provided as a reference.
Other Images in This Article
Copyright and Terms & Conditions
© 2024. The Author(s). Published by the American Astronomical Society.