Image Details
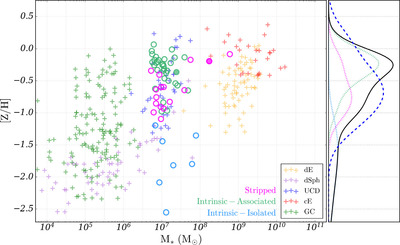
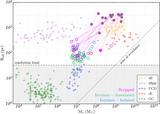
Caption: Figure 5.
The stellar mass–metallicity relation of the compact objects. The marker for each sample is identical to that of Figure 4. The right panel shows [Z/H] histograms of the UCD candidates in NewHorizon (magenta, green, and blue curves for stripped, intrinsically associated, and intrinsically isolated samples, respectively) scaled by their counts (12, 19, and 7). Their sum (solid black curve) is compared with the observed UCDs (blue dashed curve) for the same PDF weight.
Other Images in This Article
Copyright and Terms & Conditions
© 2024. The Author(s). Published by the American Astronomical Society.
Copyright ©
2025 Astronomy Image Explorer. All Rights Reserved.