Image Details
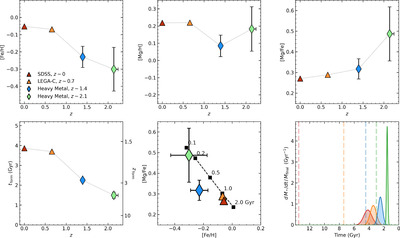
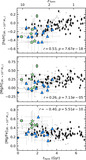
Caption: Figure 3.
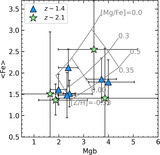
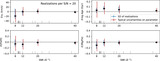
Average elemental abundance and stellar age results for the Heavy Metal galaxies at z ∼ 1.4 and z ∼ 2.1 and for stacks of massive quiescent galaxies at z ∼ 0 and z ∼ 0.7 across various axes. The error bars on the SDSS and LEGA-C data points are smaller than the symbol size. Top row: the [Fe/H], [Mg/H], and [Mg/Fe] abundances as a function of redshift. Bottom row: the left panel shows the formation time as a function of redshift. In the middle panel, we compare the average abundances on the [Fe/H]–[Mg/Fe] plane to a simple closed-box chemical evolution model (black dashed line). Black squares represent predicted elemental abundances for various star formation timescales, denoted in Gyr. The right panel shows the inferred star formation history at each redshift interval. The age of the Universe for each sample is marked with a dashed line. Typical quiescent galaxies at higher redshift formed earlier and over shorter timescales than massive quiescent galaxies today.
Other Images in This Article
Copyright and Terms & Conditions
© 2024. The Author(s). Published by the American Astronomical Society.