Image Details
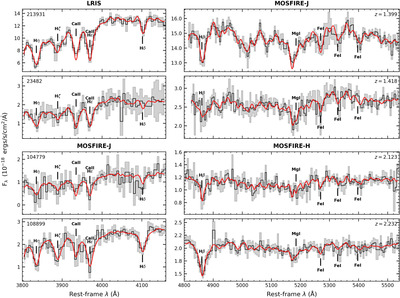
Caption: Figure 1.
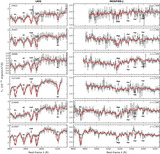
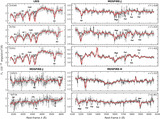
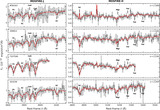
Spectra (black) and corresponding 1σ uncertainties on the flux (gray), along with the best-fitting alf models used to derive the ages and elemental abundances (red) of four example primary Heavy Metal Survey targets (two at z ∼ 1.4 and two at z ∼ 2.2). The other spectra can be found in Appendix A. Spectra are binned such that 1 pixel is ≃5 Å in the rest frame. The spectra were fit before binning.
Other Images in This Article
Copyright and Terms & Conditions
© 2024. The Author(s). Published by the American Astronomical Society.
Copyright ©
2025 Astronomy Image Explorer. All Rights Reserved.