Image Details
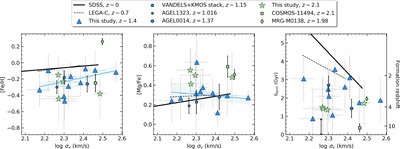
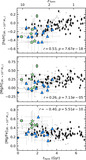
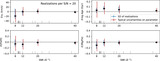
Caption: Figure 2.
[Fe/H] (left), [Mg/Fe] (middle), and formation redshift (right) results for the z ∼ 1.4 (blue triangles) and z ∼ 2.1 (green stars) Heavy Metal targets as a function of stellar velocity dispersion. The black solid line shows the σ v abundance relations of massive quiescent galaxies at z ∼ 0 (Conroy et al. 2014; Beverage et al. 2021), while the black dashed lines denote relations at z ∼ 0.7 (Beverage et al. 2023). We include a quiescent galaxy at z = 2.1 (green square; Kriek et al. 2016), a lensed quiescent galaxy at z = 1.98 (green diamond; Jafariyazani et al. 2020), a stack of quiescent galaxies at 1.0 < z < 1.3 (blue pentagon; Carnall et al. 2022), and two lensed quiescent galaxies at z = 1.016 and z = 1.37 (blue circles; Zhuang et al. 2023). The solid blue line in the left panel represents the best-fit σ v –[Fe/H] with the 16th and 84th percentile uncertainties on the fit shown in light blue. The results from all studies were derived using alf. Quiescent galaxies at z > 0.7 have lower [Fe/H], enhanced [Mg/Fe], and earlier formation times than galaxies at lower redshifts.
Other Images in This Article
Copyright and Terms & Conditions
© 2024. The Author(s). Published by the American Astronomical Society.