Image Details
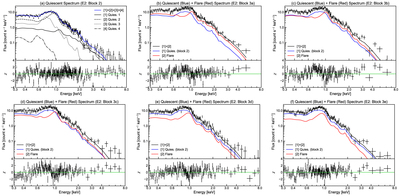
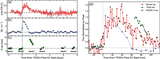
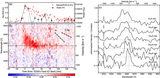
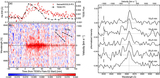
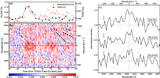
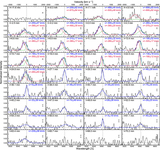
Caption: Figure 13.
NICER X-ray spectrum of the superflare on 2022 April 16 (E2) and the corresponding fitting results (applied to the range of 0.3–8.0 keV). (a) Fitting results for the pre-flare spectrum of block 2 of E2, fitted with four apec components (each represented by a black line). The blue line represents the total model spectrum, which is used as the pre-flare spectrum in panels (b) through (f). (b–f) Observed and model spectra when flare block 3 is divided into blocks 3a through 3e. Refer to Figure 15 for the division times and Tables 5 and 6 for the fitting parameters.
Other Images in This Article

Show More
Copyright and Terms & Conditions
© 2024. The Author(s). Published by the American Astronomical Society.
Copyright ©
2025 Astronomy Image Explorer. All Rights Reserved.