Image Details

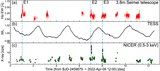
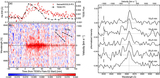
Caption: Figure 3.
Light curves for the superflare observed on 2022 April 10 (E1). (a) The red line is pre-flare subtracted Hα equivalent width (ΔEW = − (EW–EW﹩{}_{\mathrm{preflare}}﹩)) with the grayed error bars. Note that positive ΔEW values correspond to emissions. The Hα EW is calculated within a range of 6562.8 ± 20 Å, which differs from the definition applied to flares E2 and E3 (i.e., 6562.8 ± 10 Å). (b) Background-subtracted TESS WL (=(F − F bkg)/F av ). (c) Soft X-ray count rate (0.5–3 keV). In panel (c), each ISS orbit on this day is labeled as block 1–6. (d) Hα ΔEW and WL, each normalized by their respective peak values. In each panel, the vertical dashed line marks the TESS flare onset time, and the horizontal dashed line depicts the basal level for each wavelength (Hα: median value of −80 to −20 minutes; soft X-ray: mean value of block 3).
Other Images in This Article

Show More
Copyright and Terms & Conditions
© 2024. The Author(s). Published by the American Astronomical Society.