Image Details
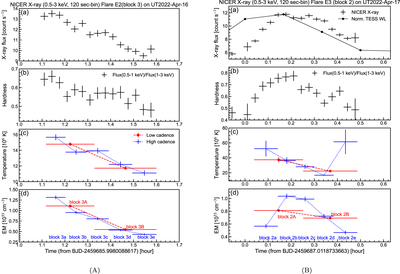
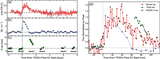
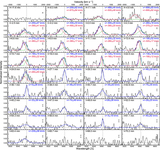
Caption: Figure 15.
Temporal evolution of the X-ray spectral fitting results for superflares E2 (A) and E3 (B). (a) Light curves of X-ray count rates with a time resolution of 2 minutes in the 0.5–3 keV range. (b) Hardness ratio, which is obtained by dividing the flux in the 0.5–1 keV range by the flux in the 1–3 keV range. (c) Temporal change in temperature, with different colors indicating different time resolutions. (d) Temporal change in the emission measure (EM).
Other Images in This Article

Show More
Copyright and Terms & Conditions
© 2024. The Author(s). Published by the American Astronomical Society.
Copyright ©
2025 Astronomy Image Explorer. All Rights Reserved.