Image Details

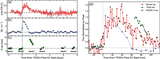
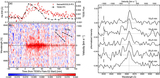
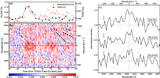
Caption: Figure 6.
Time evolution of pre-flare subtracted Hα spectra of the superflare observed on 2022 April 10 (E1). (a) Reference light curves in Hα ΔEW (scaled on the left vertical axis) and white light (scaled on the right vertical axis). (b) A dynamic spectrum of the pre-flare subtracted Hα spectrum, plotted on the time-wavelength plane. The red (blue) color represents emission (absorption) signals, with the upper part indicating shorter wavelengths (i.e., blueshift), following the unified format used in our series of papers (Namekata et al. 2022c; Namekata et al. 2022d). The color bar shows the nondimensional intensity, which is normalized by the continuum level. The dashed lines indicate the stellar surface gravity (g *) and half of the surface gravity (0.5 · g *). (c) Time-binned, pre-flare subtracted Hα spectra during the superflare. Detailed spectra can be seen in Figure 9. The 1σ errors in the continuum level are plotted as error bars for reference.
Other Images in This Article

Show More
Copyright and Terms & Conditions
© 2024. The Author(s). Published by the American Astronomical Society.