Image Details
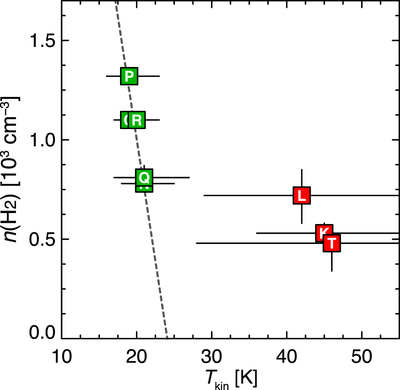
Caption: Figure 4.
Scatter plot between T kin and n(H2). The dashed line indicates the linear regression using the least-squares method except for the CO clouds L, K, and T (see the text).
Other Images in This Article

Copyright and Terms & Conditions
© 2023. The Author(s). Published by the American Astronomical Society.
Copyright ©
2025 Astronomy Image Explorer. All Rights Reserved.