Image Details
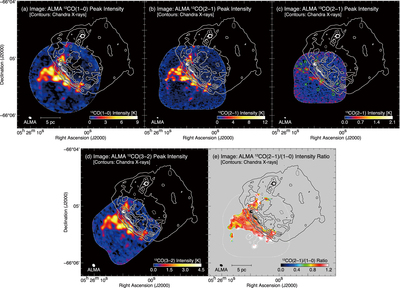
Caption: Figure 1.
Peak intensity maps of (a) 12CO(J = 1–0), (b) 12CO(J = 2–1), (c) 13CO(J = 2–1), and (d) 12CO(J = 3–2). (e) Intensity ratio map of 12CO(J = 2–1)/12CO(J = 1–0) (hereafter R 2−1/1−0). The velocity range of CO is from 285.5 to 287.8 km s−1. Superposed contours represent Chandra X-ray intensity in the energy band of 0.5–7.0 keV. The lowest contour level and the contour intervals are 5 × 10⁻⁷ and 3 × 10⁻⁶ photons pixel−1 s−1, respectively. The regions enclosed by dashed lines indicate the observed areas using ALMA. The CO peaks K, L, N, O–R, and T defined by Paper I are also indicated in (c). When we take the intensity ratio of R 2−1/1−0, the 12CO(J = 2–1) data were smoothed with a two-dimensional Gaussian kernel to match the effective beam size of the 12CO(J = 1–0) data. The gray shaded area in (e) represents the 12CO(J = 1–0) and/or 12CO(J = 2–1) data showing significance lower than ∼10σ.
Other Images in This Article
Copyright and Terms & Conditions
© 2023. The Author(s). Published by the American Astronomical Society.