Image Details
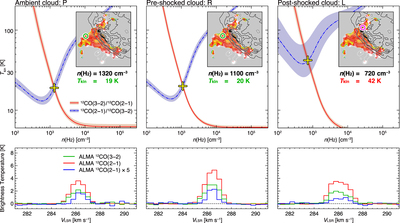
Caption: Figure 2.
Top panels: large velocity gradient results on the number density of molecular hydrogen, n(H2), and the kinetic temperature, T kin, for the ambient cloud P, pre-shocked cloud R, and the post-shocked cloud L. The red lines and blue dashed-dotted lines indicate the intensity ratios of 12CO(J = 3–2)/12CO(J =2–1) and 13CO(J = 2–1)/12CO(J =3–2), respectively. The shaded areas surrounding the red and blue lines indicate the 1σ ranges of each intensity ratio. Yellow crosses represent the best-fit values of n(H2) and T kin for each cloud. The spatial positions and best-fit values for each cloud are shown in the top-right corners for each panel. Bottom panels: CO intensity profiles for clouds P, R, and L. The physical properties of each cloud are summarized in Table 1.
Other Images in This Article

Copyright and Terms & Conditions
© 2023. The Author(s). Published by the American Astronomical Society.