Image Details
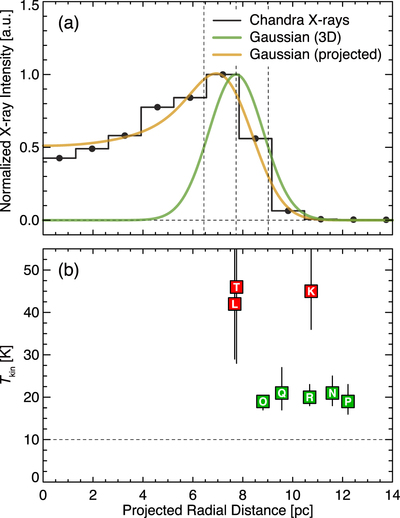
Caption: Figure 3.
(a) Radial profile of the normalized X-ray intensity, centered at (α J2000, δ J2000) = (05h25m59.ˢ57, ﹩-66^\circ 04^{\prime} 56\buildrel{\rm{s}}\over{.} 4﹩) as the geometric center of the SNR. The steps with filled circles indicate averaged values of normalized X-ray intensity at each annulus. The green line indicates the three-dimensional Gaussian distribution, and the orange line represents its projected distribution given by the least-squares fitting (see the text). (b) Scatter plot of kinetic temperature T kin for each cloud as a function of the projected radial distance. The dashed horizontal line represents T kin=10 K, corresponding to the typical temperature of quiescent molecular clouds. The red and green symbols represent high- and moderate-temperature clouds, respectively.
Other Images in This Article

Copyright and Terms & Conditions
© 2023. The Author(s). Published by the American Astronomical Society.