Image Details
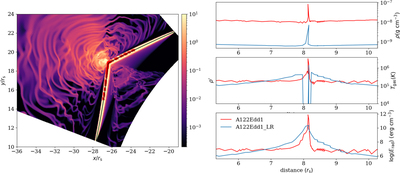
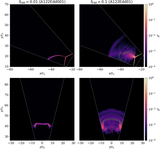
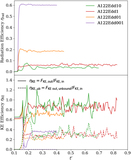
Caption: Figure 22.
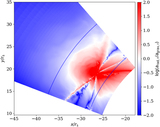
Left: gas density snapshot of A122Edd1 volume averaged from ϕ = 1.56 to 1.59 near the θ = π/2 plane, a zoom-in view of Figure 3 (upper left panel). The black solid line is part of the ballistic trajectory, equivalent to the orbit shown in Figure 2. Red crosses are the sampled data points for the right panels. Right: gas density (top panel), gas temperature (middle panel), and radiation energy density (bottom panel) as a function of distance to the stream injection point at the inner ϕ boundary. The curves are plotted with the data sampled from the left panel along the stream before collision (indicated by the red crosses). The blue lines are for A122Edd1_LR, and the red lines are for A122Edd1.
Other Images in This Article
Show More
Copyright and Terms & Conditions
© 2023. The Author(s). Published by the American Astronomical Society.