Image Details
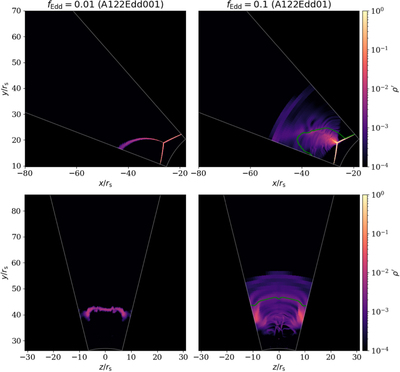
Caption: Figure 8.
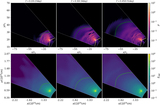
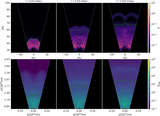
Gas density snapshots at t = 0.3 for A122Edd001 (left column) and A122Edd01 (right column). In each column, the upper panel shows the top view (volume averaged from θ = 1.56 to 1.59 near the θ = π/2 plane), and the lower panel shows the side view (volume averaged from ϕ = 2.52 to 2.55 near the mid-ϕ plane). The green solid line is the photosphere surface as defined in Equation (9). When comparing with the fiducial simulation A122Edd1 (Figures 5 and 6), notice the different color normalization in this figure to better show low-density gas.
Other Images in This Article
Show More
Copyright and Terms & Conditions
© 2023. The Author(s). Published by the American Astronomical Society.
Copyright ©
2025 Astronomy Image Explorer. All Rights Reserved.