Image Details
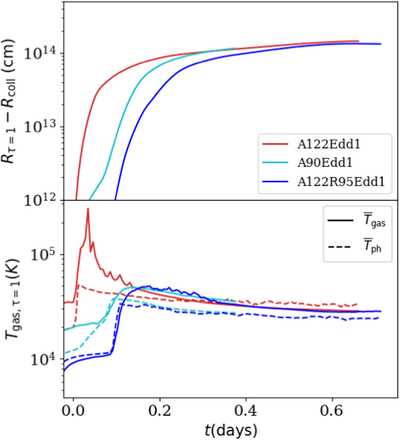
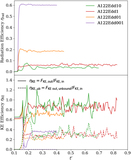
Caption: Figure 19.
Evolution of the average photosphere radius R τ=1 (upper panel) and temperature for A122Edd1 (red), A90Edd1 (cyan), and A122R95Edd1 (blue). The plotted time is normalized to days since the collision. In the lower panel, the solid lines are the average gas temperature at the R τ=1 surface, and the dashed lines are the estimated photosphere temperature according to Equation (13).
Other Images in This Article
Show More
Copyright and Terms & Conditions
© 2023. The Author(s). Published by the American Astronomical Society.
Copyright ©
2025 Astronomy Image Explorer. All Rights Reserved.