Image Details
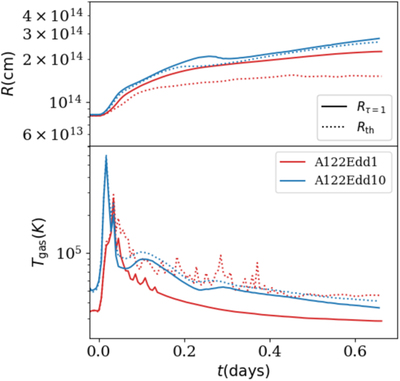
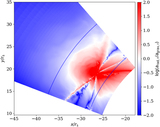
Caption: Figure 18.
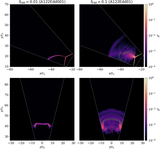
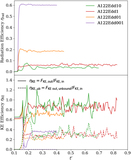
Upper panel: comparing the average scatter photosphere radius R τ=1 (solid lines) and thermalization radius R th (dotted lines). The time is normalized to days since collision. Lower panel: measured average gas temperature at the R τ=1 (solid lines) and R th (dotted lines) surface.
Other Images in This Article
Show More
Copyright and Terms & Conditions
© 2023. The Author(s). Published by the American Astronomical Society.
Copyright ©
2025 Astronomy Image Explorer. All Rights Reserved.