Image Details
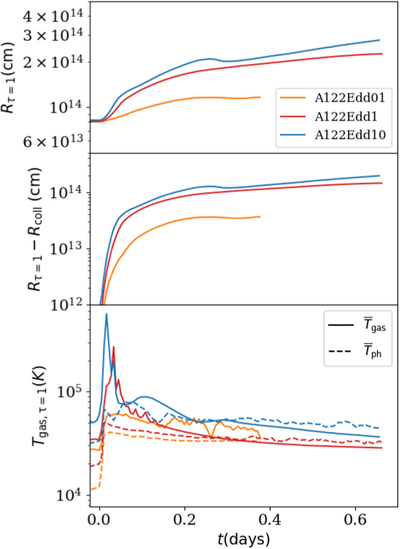
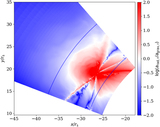
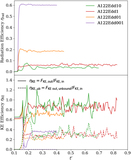
Caption: Figure 16.
Evolution of the average photosphere radius R τ=1 (upper panel), the increment of R τ=1 (middle panel), and the average temperature. The time is normalized to days since collision. In the lower panel, the solid lines are the measured average gas temperature at the R τ=1 surface, and the dashed lines are the estimated radiation temperature according to Equation (13).
Other Images in This Article
Show More
Copyright and Terms & Conditions
© 2023. The Author(s). Published by the American Astronomical Society.
Copyright ©
2025 Astronomy Image Explorer. All Rights Reserved.