Image Details
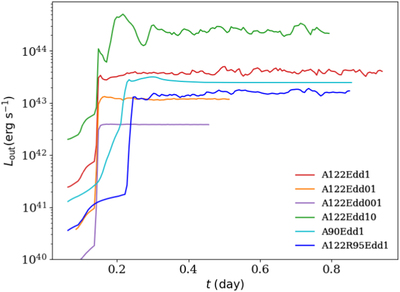
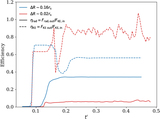
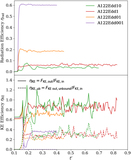
Caption: Figure 15.
Total luminosity measured from (27, 40) × (0.42π, 0.58π) × (0.81π, 0.96π) (i.e., the simulation domain up to r = 40.0) as a function of time. The red, orange, purple, and green solid lines are for mass fallback rates with f Edd = 0.01, 0.1, 1.0, and 10.0, respectively. The cyan line shows the smaller collision angle of 90° with f Edd = 1.0. The blue line shows the larger collision radius of r coll ≈ 95r s with f Edd = 1.0.
Other Images in This Article
Show More
Copyright and Terms & Conditions
© 2023. The Author(s). Published by the American Astronomical Society.
Copyright ©
2025 Astronomy Image Explorer. All Rights Reserved.