Image Details
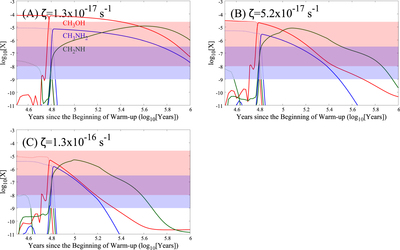
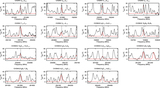
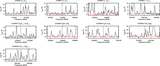
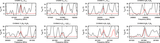
Caption: Figure 14.
The results of the chemical model with the different cosmic-ray ionization rates of ζ = 1.3 × 10⁻¹⁷, 5.2 × 10⁻¹⁷, and 1.3 × 10⁻¹⁶ s−1, respectively, for Models A, B, and C. The simulated fractional abundances, X, of CH3OH, CH3NH2, and CH2NH in the gas phase are shown by red, blue, and green solid lines, respectively. The dotted line represents the sum of the fractional abundances in the grain mantle and on the grain surface. The region where the model can reproduce the observed values within a factor of 10 is indicated by red and blue for CH3OH and CH3NH2, respectively, and the overlapping region is painted by gray.
Other Images in This Article
Show More
Copyright and Terms & Conditions
© 2023. The Author(s). Published by the American Astronomical Society.