Image Details
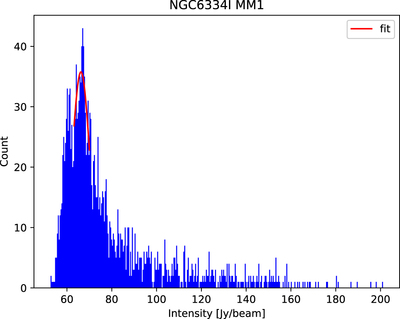
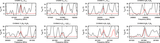
Caption: Figure 1.
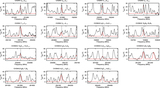
An example of the intensity histogram obtained for the NGC 6334I MM1 region. The mean and the standard deviation were obtained through Gaussian fitting to subtract the continuum emission.
Other Images in This Article
Show More
Copyright and Terms & Conditions
© 2023. The Author(s). Published by the American Astronomical Society.
Copyright ©
2025 Astronomy Image Explorer. All Rights Reserved.