Image Details
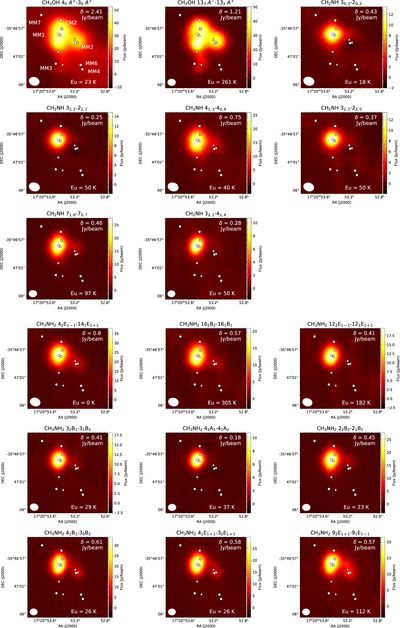
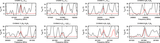
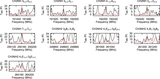
Caption: Figure 3.
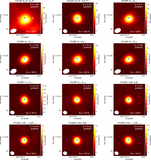
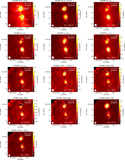
Figures are continued on the next page. The integrated intensity maps of CH3OH, CH3NH2, and CH2NH transitions in NGC 6334I. The rms noise level, δ Jy beam−1, is shown at the top right. The positions of the continuum sources (Hunter et al. 2006; Brogan et al. 2016) are shown by circles. The triangles show the positions of hot cores MM1, MM2, and MM3, where the spectra were extracted. The positions observed by Bøgelund et al. (2019) are marked with Xs. The velocity ranges are from −14.6 to −0.9, from −14.2 to −5.9, and from −13.9 to −0.2 km s−1 for CH3OH, CH3NH2, and CH2NH, respectively. The upper energy level is shown at the bottom left of the figures.
Other Images in This Article
Show More
Copyright and Terms & Conditions
© 2023. The Author(s). Published by the American Astronomical Society.