Image Details
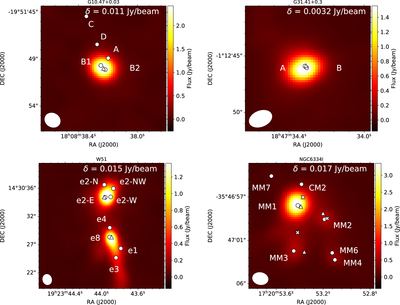
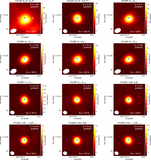
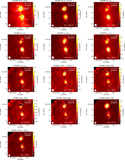
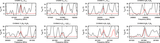
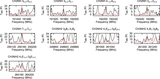
Caption: Figure 2.
The continuum emission maps created in the spectral window of Band 5, whose center frequency is 203.050 GHz and bandwidth is 0.938 GHz. The spatial scale of 1″ corresponds to a physical distance of 1.3 × 10³, 8.5 × 10³, 3.8 × 10³, and 5.4 × 10³ au, respectively, for NGC 6334I, G10.47+0.03, G31.41+0.3, and W51. The circles represent the positions of previously detected continuum emission. The triangles depict the positions where we extracted the spectra. For NGC 6334I, We show the position observed by Bøgelund et al. (2019). The circles denotes the previously detected continuum peaks. We extracted the spectra from the positions shown by triangles. For detailed information of each source, see the captions in Figures 4–6.
Other Images in This Article
Show More
Copyright and Terms & Conditions
© 2023. The Author(s). Published by the American Astronomical Society.