Image Details
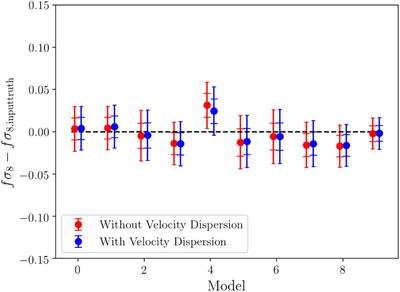
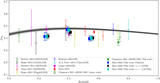
Caption: Figure 23.
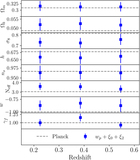
Impact of velocity dispersion on the measurement of structure growth rate. The tests are done with 10 randomly chosen models. The result shows the difference of f σ 8 recovered from the mock with respect to the input truth. The red dots with error bars denote results without additional velocity dispersion, while the blue dots denote mocks with an additional velocity component. For plotting purposes, the points for the same model are shifted slightly along the x-axis and the error bars represent 1σ and 2σ.
Other Images in This Article
Show More
Copyright and Terms & Conditions
© 2023. The Author(s). Published by the American Astronomical Society.
Copyright ©
2025 Astronomy Image Explorer. All Rights Reserved.