Image Details
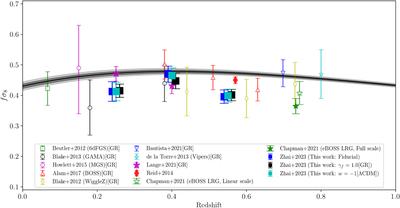
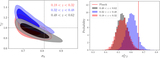
Caption: Figure 9.
Measurement of the growth rate of structure from our analysis using BOSS DR12 galaxies, as well as a compilation of the results in the literature. The black line with the shaded area indicates the prediction from the Planck 2018 release assuming a flat ΛCDM cosmology. The data include 6dFGS (Beutler et al. 2012), GAMA (Blake et al. 2013), SDSS-I/II main galaxy sample (Howlett et al. 2015, MGS), WiggleZ (Blake et al. 2012), Vipers (de la Torre et al. 2013), and eBOSS-LRG (Bautista et al. 2021). In addition, we also display measurements using BOSS galaxies similar to our work: DR12 final consensus results (Alam et al. 2017), BOSS-CMASS RSD analysis (Reid et al. 2014), and BOSS LOWZ small-scale analysis (Lange et al. 2022). Note that our results of f σ 8 is quoted from the measurement of f σ 8 γ f . We omit γ f in the y-axis to be in line with the measurements used for cosmological implications. In other words, except for our analysis (including Chapman et al. 2022) and Reid et al. (2014), all the other studies implicitly assume γ f = 1, i.e., the gravitational interaction is described by GR. The symbols are split into two categories: large-scale (open) and small-scale (filled) measurements. Note that our measurements and eBOSS results at the same redshifts are shifted slightly for plotting purposes.
Other Images in This Article
Show More
Copyright and Terms & Conditions
© 2023. The Author(s). Published by the American Astronomical Society.