Image Details
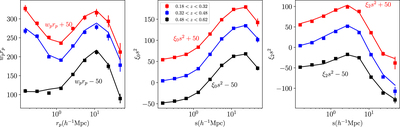
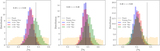
Caption: Figure 3.
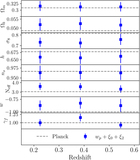
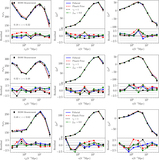
2PCF of BOSS galaxies, including w p (left), ξ 0(middle), and ξ 2 (right) for all three redshift bins. The lines are the prediction of the best-fit model with varying cosmology, HOD, and assembly bias parameter, assuming the fiducial model for the covariance matrix (see more details in Section 6.1). The best-fit model uses data from w p + ξ 0 + ξ 2. The results for low-z and high-z are shifted slightly for plotting purposes.
Other Images in This Article
Show More
Copyright and Terms & Conditions
© 2023. The Author(s). Published by the American Astronomical Society.