Image Details
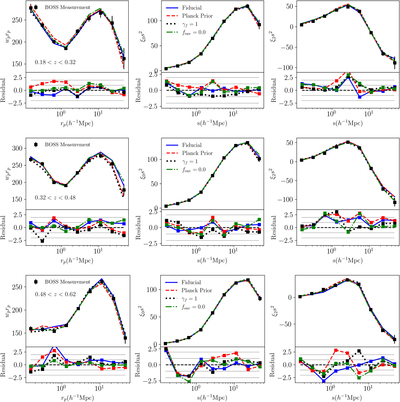
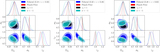
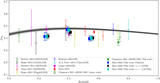
Caption: Figure 6.
Best-fit model of w p (left), ξ 0 (middle), and ξ 2 (right) for three subsamples, as well as the residuals with respect to the BOSS measurements. Different lines correspond to the tests as explained in the text. The bottom panels of each plot show the residual normalized by the observed uncertainty, and the horizontal thin lines correspond to the 1σ and 2σ levels.
Other Images in This Article
Show More
Copyright and Terms & Conditions
© 2023. The Author(s). Published by the American Astronomical Society.
Copyright ©
2025 Astronomy Image Explorer. All Rights Reserved.