Image Details
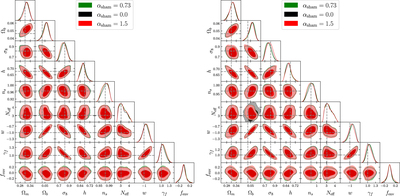
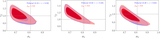
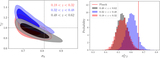
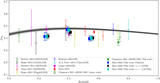
Caption: Figure 19.
Test on the SHAM catalog constructed using UNIT simulation with α sham = 1 and scatter = 0.08. The galaxy statistics employed in the analysis is w p + ξ 0 + ξ 2 for the high-z subsample. The left-hand panel shows the SHAM catalog constructed with scatter = 0.15, while the right-hand panel is for scatter = 0.19. The test is done on SHAM catalogs with different values of α sham, which is a measure of the significance of assembly bias. The result shows that our HOD-based model can give unbiased recovery of the input cosmology.
Other Images in This Article
Show More
Copyright and Terms & Conditions
© 2023. The Author(s). Published by the American Astronomical Society.