Image Details
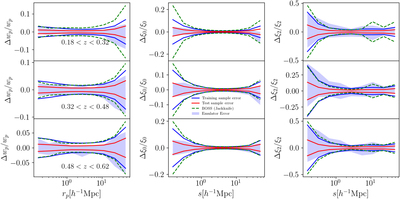
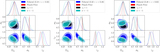
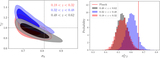
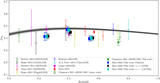
Caption: Figure 15.
Performance of the emulator for w p (left), ξ 0 (middle), and ξ 2 (right) for three redshifts. The solid blue line stands for the training error, while the red line stands for the error of the test samples. We also show the uncertainty from BOSS measurement as green dashed lines for reference. The test samples have multiple boxes and populations to suppress sample variance and shot noise. The shaded area represents the inner 68% distribution of the emulator performance.
Other Images in This Article
Show More
Copyright and Terms & Conditions
© 2023. The Author(s). Published by the American Astronomical Society.
Copyright ©
2025 Astronomy Image Explorer. All Rights Reserved.