Image Details
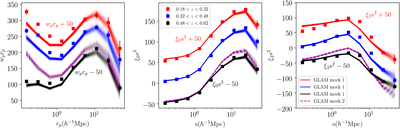
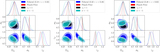
Caption: Figure 13.
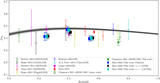
Correlation function of the GLAM mocks to construct the covariance matrix. The squares with error bars are measurements from BOSS galaxies. The red, blue, and black lines are obtained by populating the GLAM mocks with an optimized HOD parameter set and the GLAM cosmology. We do not require the mocks to give consistent results as observation, since the GLAM cosmology may not be the true cosmology. In order to further test the covariance matrix, we randomly pick a HOD model to populate the GLAM halo catalog for high-z galaxies, as shown by the dashed purple lines. The clustering amplitude shows different behavior but the correlation matrix only shows mild variation.
Other Images in This Article
Show More
Copyright and Terms & Conditions
© 2023. The Author(s). Published by the American Astronomical Society.