Image Details
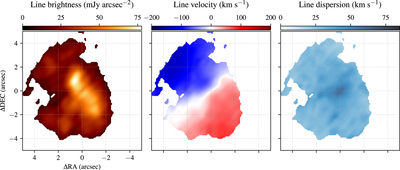
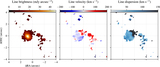
Caption: Figure 6.
HNC emission in Circinus. The left panel shows the spatial distribution of the fitted line brightness, the middle panel shows the spatial distribution of the fitted line velocity, and the right panel shows the spatial distribution of the fitted line dispersion; these quantities correspond to the A, v 0, and σ parameters from Equation (C1), respectively. Each panel’s image is centered as in Figure 5 and in the right panel of Figure 3. We mask out all regions of the image that have a fractional uncertainty in A larger than 20% (5σ).
Other Images in This Article
Copyright and Terms & Conditions
© 2023. The Author(s). Published by the American Astronomical Society.
Copyright ©
2025 Astronomy Image Explorer. All Rights Reserved.