Image Details
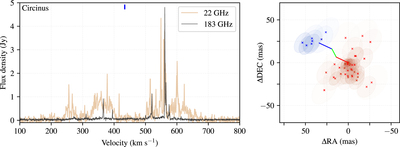
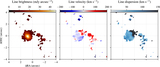
Caption: Figure 3.
Spectra (left) and map (right) for the Circinus galaxy. The left panel shows a comparison of the 183 GHz spectrum (in black) and the 22 GHz spectrum (in red), as in Figures 1 and 2; the 22 GHz spectrum was taken with the Parkes Telescope in 1997 August and is reproduced from Braatz et al. (2003) (see Figure 1 in that paper). The systemic velocity of the galaxy is marked by the blue line at the top. The right panel shows the best-fit positions of the detected 183 GHz maser spots as cross markers along with their corresponding 1σ error ellipses; we show only those masers with mean position uncertainties less than 20 mas. Each maser spot in the right panel is colored blue if it has a velocity that is blueshifted with respect to the recession velocity of the galaxy and red if it has a velocity that is redshifted with respect to the recession velocity of the galaxy. The opacity of the error ellipses scales the signal-to-noise ratio of the fit, with more tightly constrained positions having a more opaque ellipse. The overplotted blue, green, and red lines in the right panel mark the warped edge-on disk from Greenhill et al. (2003b) (see Figure 3 in that paper).
Other Images in This Article
Copyright and Terms & Conditions
© 2023. The Author(s). Published by the American Astronomical Society.