Image Details
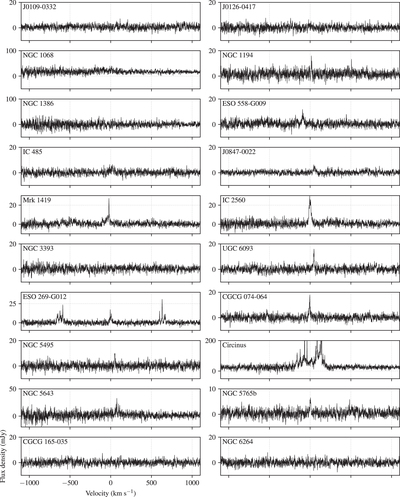
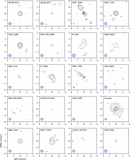
Caption: Figure 4.
The 183 GHz spectra for each of the survey targets, after boxcar smoothing in frequency by 10 channels (corresponding to a ∼2 km s−1 post-averaging spectral resolution). The velocity axis for each spectrum is referenced to the recession velocities listed in Table 1. All panels share the same velocity range, which is explicitly labeled in the lower left panel. We note that the vertical axis range for the Circinus spectrum has been restricted (the strongest emission lines are nearly 5 Jy) to more clearly show the broad pedestal of emission around the recession velocity.
Other Images in This Article
Copyright and Terms & Conditions
© 2023. The Author(s). Published by the American Astronomical Society.
Copyright ©
2025 Astronomy Image Explorer. All Rights Reserved.