Image Details
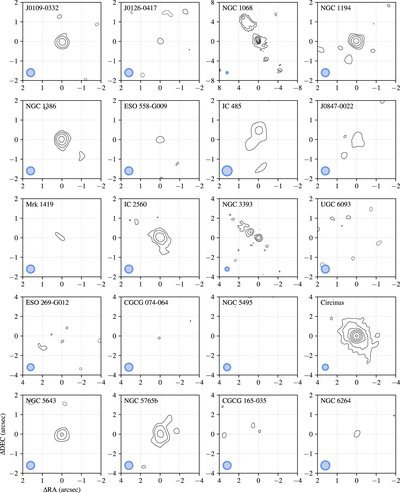
Caption: Figure 5.
The 183 GHz continuum images for each of the survey targets. The outermost contours mark a brightness level of three times the image rms (see Table 2), and each subsequent contour marks a brightness level that is larger by a factor of two than that of the previous contour. In each panel, the image is centered on the location of the maser emission (if it is present) or on the peak of the continuum emission (if maser emission is not present); for the one galaxy without either continuum or maser emission detections (CGCG 165-035), we center the image on the expected location of the galaxy (see Table 1). The FWHM restoring beam size is shown in the lower left-hand corner of each panel.
Other Images in This Article
Copyright and Terms & Conditions
© 2023. The Author(s). Published by the American Astronomical Society.