Image Details
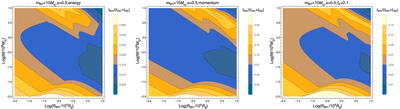
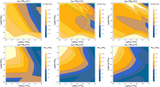
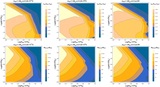
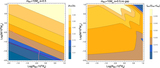
Caption: Figure 8.
Comparison between the BH accretion timescale and the cavity evolution timescale under the different treatments of shell expansion. The Left and middle panels represent the extremely entire adiabatic and momentum conservation evolution of the shell, respectively. The right panel represents the shell evolution as described in Section 3.1, but set f w = 0.1 to denote a weaker outflow. We set s = 0.5 as an example, verifying but not showing for brevity, the properties of other s value cases are similar.
Other Images in This Article

Show More
Copyright and Terms & Conditions
© 2023. The Author(s). Published by the American Astronomical Society.
Copyright ©
2025 Astronomy Image Explorer. All Rights Reserved.