Image Details
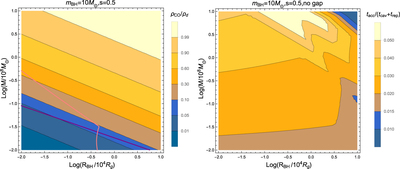
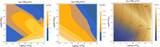
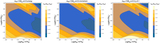
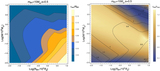
Caption: Figure 10.
Properties of the CO-gravity-induced gap, and the outflow feedback neglecting the gap effects of the m BH = 10M ⊙ case. The left panel shows a comparison between the gap density and the unperturbed AGN disk gas density ρ CO/ρ d; the pink line and left region represent R d,gap ≥ r cav; the purple line and left region represent t gap,g < t ref, as a contrast, and t gap,v > t ref always holds within the panel’s parameter space. The right panel shows a comparison between the BH accretion timescale and the cavity evolution timescale for the gap unopened case, i.e., ρ CO = ρ d.
Other Images in This Article
Show More
Copyright and Terms & Conditions
© 2023. The Author(s). Published by the American Astronomical Society.