Image Details
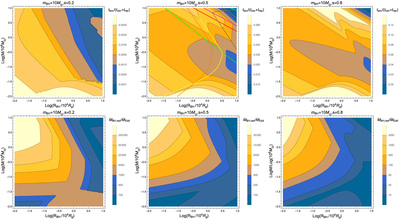
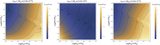
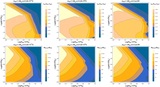
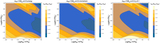
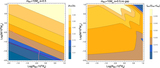
Caption: Figure 5.
Comparison between the BH accretion timescale and the cavity evolution timescale, and the corresponding reduced BH mass accretion rate. Top rows show t acc/(t cav + t ref) and bottom rows show ﹩{\dot{M}}_{\mathrm{BH},\mathrm{red}}/{\dot{M}}_{\mathrm{Edd}}﹩. Three columns show the s = 0.2, 0.5, and 0.8 cases with m BH = 10M ⊙, respectively. In the top-middle panel, the magenta, red, and green lines represent the same boundaries as in Figure 1; the yellow, orange, brown lines, and left regions represent the boundaries of ﹩{r}_{\mathrm{obd}}\leqslant {r}_{\mathrm{tr}}﹩, r obd ≤ r rad−gas, and r obd ≤ r es−ff, respectively; the cyan line and above region represent the boundary of ﹩{t}_{\mathrm{acc}}\leqslant {t}_{\mathrm{bre}}﹩.
Other Images in This Article

Show More
Copyright and Terms & Conditions
© 2023. The Author(s). Published by the American Astronomical Society.