Image Details
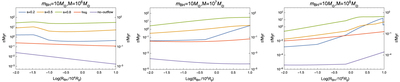
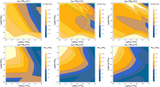
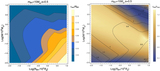
Caption: Figure 13.
The characteristic timescales linked to the mass growth and the migration of CO embedded in the AGN disk, e.g., an m BH = 10M ⊙ BH. The lines of s = 0.2, 0.5, and 0.8 represent t grow for the cases of varying outflow strength, respectively. The orange and purple lines represent the migration timescale t mig, of which the AGN disk structure is specifically expressed as Equation (1), and the mass growth timescale t nowind leaving out the outflow formation, respectively. Basically, t nowind ≪ t mig < t grow is valid.
Other Images in This Article

Show More
Copyright and Terms & Conditions
© 2023. The Author(s). Published by the American Astronomical Society.