Image Details
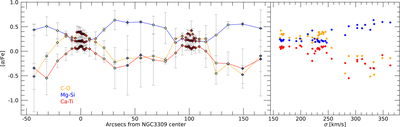
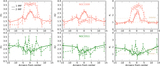
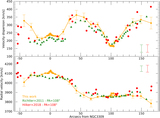
Caption: Figure 14.
[α/Fe] trend when averaging: C–O (orange), Mg–Si (blue), and Ca–Ti (red). The left panel shows these as a function of the distance from NGC3309, and the right panel as a function of the velocity dispersion. Error bars in the left panel are the standard deviations of each average; to make the trends more visually clear, error bars are omitted in the right panel.
Other Images in This Article

Show More
Copyright and Terms & Conditions
© 2023. The Author(s). Published by the American Astronomical Society.
Copyright ©
2025 Astronomy Image Explorer. All Rights Reserved.