Image Details
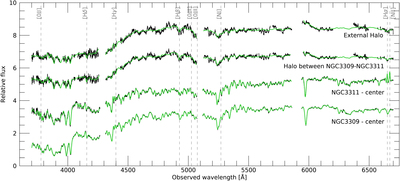
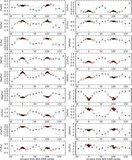
Caption: Figure 5.
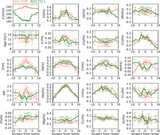
Same four example spectra as in Figure 2 (center of NGC3309, center of NGC3331, halo between the two galaxies, and external halo) in the optical region, and the best-fit spectra (green). Fitted emission lines are indicated by gray vertical dashed lines. Fluxes are normalized around 4500–5500 Å and shifted for clarity.
Other Images in This Article

Show More
Copyright and Terms & Conditions
© 2023. The Author(s). Published by the American Astronomical Society.
Copyright ©
2025 Astronomy Image Explorer. All Rights Reserved.