Image Details
Caption: Figure 1.
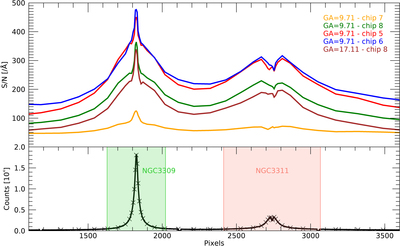
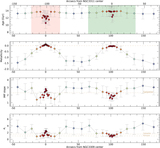
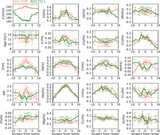
Upper panel: S/N per Å trends along the slit direction as measured for each CCD chip on the final reduced spectra. The pixel scale is 0.111 per pixel. In detail: chip7-GA = 9.°71 covers ∼3500–4300 Å (orange), chip8-GA = 9.°71 ∼4300–5100 Å (green), chip5-GA = 9.°71 5100–5900 Å (red), chip6-GA = 9.°71 5900–6700 Å (blue), and chip8-GA = 17.°11 ∼8000–8800 Å(brown). Lower panel: light profile along the slit that connects the two target galaxies NGC3309 (green) and NGC3311 (pink). Shades highlight the region within 1R e for each galaxy, i.e., ﹩{{\rm{R}}}_{e}^{3309}=21.9﹩ and ﹩{{\rm{R}}}_{e}^{3311}=36.2﹩ (Arnaboldi et al. 2012). Crosses indicate the central position of each region where a spectrum has been extracted.
Other Images in This Article

Show More
Copyright and Terms & Conditions
© 2023. The Author(s). Published by the American Astronomical Society.