Image Details
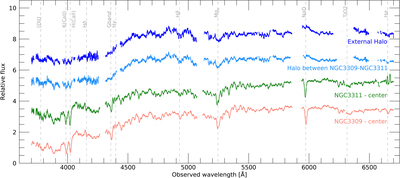
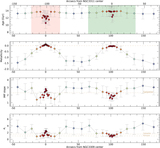
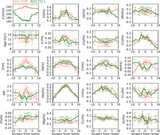
Caption: Figure 2.
Four examples of the final reduced spectra in the optical region: the center of NGC3309 (pink), the center of NGC3311 (green), a region of the halo between the two galaxies (light blue), and an external region at the east of NGC3311 (blue). Some representative spectral features are shown (gray). Hα is visible in absorption for NGC3309 and in absorption+emission for NGC3311 because its core has a dust disk where star formation is ongoing (Arnaboldi et al. 2012; Richtler et al. 2020). Gaps between CCD chips can be noticed around 4300, 5100, and 5900 Å. Other masked regions are due to sky residuals and foreground emission (see text). Fluxes are normalized around 4500–5500 Å and shifted for clarity.
Other Images in This Article

Show More
Copyright and Terms & Conditions
© 2023. The Author(s). Published by the American Astronomical Society.