Image Details
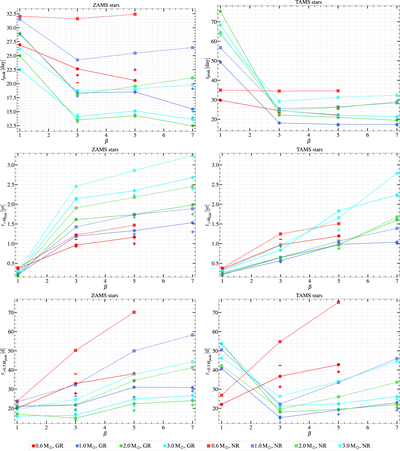
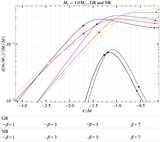
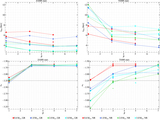
Caption: Figure 8.
Characteristic timescales t peak (top), t Edd (middle), and ﹩{t}_{\gt 0.5{\dot{M}}_{\mathrm{peak}}}﹩ (bottom) for ZAMS (left) and TAMS (right) stars for different M ⋆, a, and β. The “+” and “-” symbols indicate the results from the disruptions of stars on prograde and retrograde orbits, respectively. The results for the GR and NR simulations are indicated with “•” and “▪” symbols, respectively.
Other Images in This Article
Copyright and Terms & Conditions
© 2023. The Author(s). Published by the American Astronomical Society.
Copyright ©
2025 Astronomy Image Explorer. All Rights Reserved.