Image Details
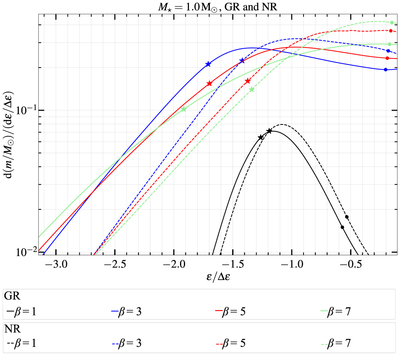
Caption: Figure 4.
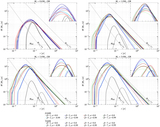
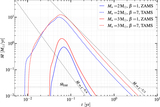
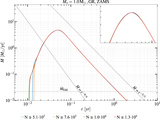
Mass distribution of the debris over the total specific energy dM/d ϵ for 1 M ⊙ ZAMS stars calculated from the final snapshot of the simulations. The “⋆” symbols illustrate the values of dM/d ϵ that correspond to the maxima of ﹩\dot{M}﹩, while the “•” symbols represent the time when ﹩\dot{M}﹩ decreases below ﹩{\dot{M}}_{\mathrm{Edd}}﹩ (see Figure 6). The solid and dashed lines correspond to the results from GR and NR disruptions, respectively. The values of ϵ are normalized by ﹩{\rm{\Delta }}\epsilon ={{GM}}_{\mathrm{bh}}{R}_{\star }/{R}_{{\rm{t}}}^{2}﹩.
Other Images in This Article

Copyright and Terms & Conditions
© 2023. The Author(s). Published by the American Astronomical Society.