Image Details
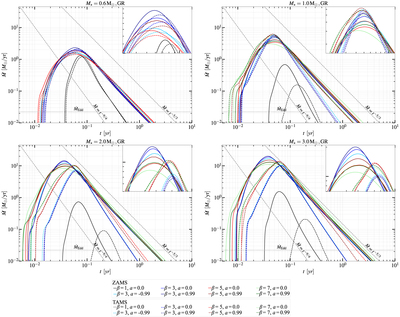
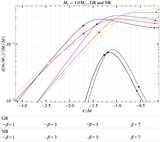
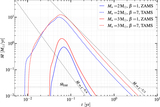
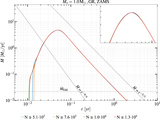
Caption: Figure 6.
﹩\dot{M}﹩ for stars with different masses and ages. The horizontal dotted line indicates the Eddington accretion rate of a 106 M ⊙ SMBH. The diagonal dotted lines represent power-law curves: t −5/3 for total stellar disruptions and t −9/4 for partial stellar disruptions. The boxes in the top right corners of the individual plots show a zoomed-in region near the peak of the ﹩\dot{M}﹩ curves.
Other Images in This Article

Copyright and Terms & Conditions
© 2023. The Author(s). Published by the American Astronomical Society.
Copyright ©
2025 Astronomy Image Explorer. All Rights Reserved.