

Image Details
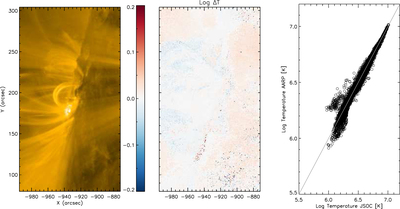
Caption: Figure 9.
Demonstrating uncertainties in the DEM results using the degradation-corrected AARP data set to reconstruct temperature, as compared to using the uncorrected JSOC downloaded image files (“ground truth”). Left: 171 Å image for context; middle: ﹩\mathrm{log}({T}_{\mathrm{ÅRP}}/{T}_{\mathrm{JSOC}})﹩ map showing spatial differences between the two; right: correlation plot between T AARP and T JSOC in log scale. The gray line shows the 1:1 correspondence line.
Other Images in This Article
Copyright and Terms & Conditions
© 2023. The Author(s). Published by the American Astronomical Society.

Copyright ©
2026 Astronomy Image Explorer. All Rights Reserved.
