

Image Details
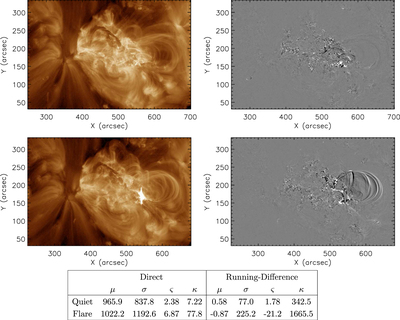
Caption: Figure 8.
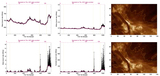
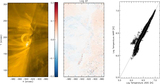
“Direct” (left) and running-difference (right) images of NOAA AR 11261 (HMI HARP 750, see Figure 4) on 2011 August 3 showing the differences between a quiet time (top, 21:46:50–21:45:38 UT) and during a small flare (bottom, 19:46:38–19:45:26 UT). Of note, the pairs of images are scaled the same, and while the flaring time does show a small patch of saturation since we avoid the AEC images, the pixels around the saturation area have extreme signals in the running-difference images as the saturated area changes with time.
Other Images in This Article
Copyright and Terms & Conditions
© 2023. The Author(s). Published by the American Astronomical Society.

Copyright ©
2026 Astronomy Image Explorer. All Rights Reserved.
